Compare Spatial Gene Expression
The visualization of spatially resolved transcriptomic data is implemented using Highcharts framework. Scatter and heatmap modules of Highcharts are used to implement the visualization of datasets generated by 7 techniques: Spatial transcriptomics, Slide-seq, LCM-seq, seqFISH, MERFISH, Liver single cell zonation and Geo-seq. Line module is used to implement the visualization of datasets generated by Tomo-seq. SpatialDB enables users to compare the spatial gene expression (compare two genes from the same sample, compare two genes from different samples of the same dataset, compare two genes from different datasets generated by the same or different techniques) implemented by the same strategy.
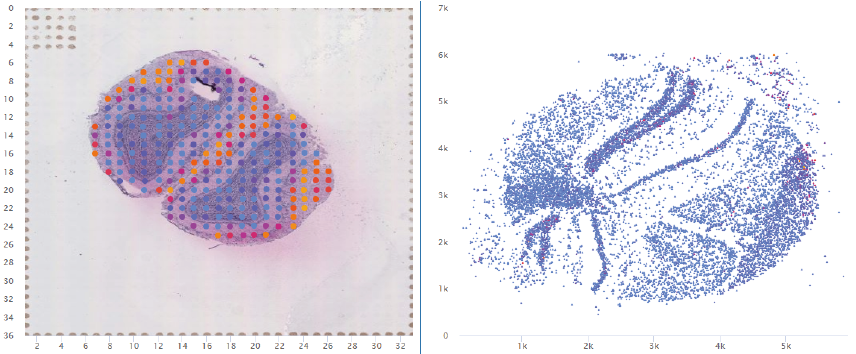
1. Click to Compare Spatial Gene Expression (Scatter and Heatmap Modules)
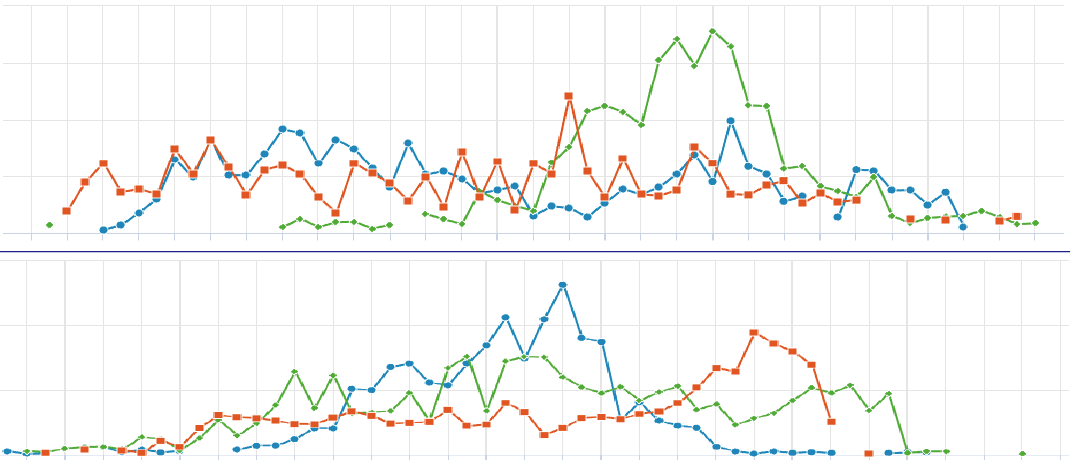
2. Click to Compare Spatial Gene Expression (Line Module)