Dataset details
| Technique | seqFISH |
|---|---|
| Title | Transcriptome-scale super-resolved imaging in tissues by RNA seqFISH+ |
| PMID | 30911168 |
| Description | SeqFISH+ can image mRNAs for 10,000 genes in single cells-with high accuracy and sub-diffraction-limit resolution-in the cortex, subventricular zone and olfactory bulb of mouse brain, using a standard confocal microscope. |
| Source | Wild-type mice C57BL/6J of post-natal day (P)23 (male) and P40 (male) were used for the cortex and olfactory bulb seqFISH+. |
| Species | mouse |
| No. genes | 10,000 genes |
| No. cells | 913 cortex cells, 2050 olfactory bulb cells. |
| Resolution | single molecule |
| Data normalization | - |
| Data availability | RNA-seq data were obtained from GEO accession number GSE98674. RNA SPOTs data were obtained from a previous study. Source data are available at https://github.com/CaiGroup/seqFISH-PLUS. |
Spatially variable genes identified by SpatialDE (Q-value<0.05)
SV genes identified by SpatialDE (Q-value<0.05)
| ID | Gene | Species | Tissue | Field of view | P-value | Q-value |
|---|---|---|---|---|---|---|
| ID | Gene | Species | Tissue | Field of view | P-value | Q-value |
SV genes identified by trendsceek (Q-value<0.05)
| ID | Gene | Species | Tissue | Field of view | Q-value(Emark) | Q-value(Vmark) | Q-value(MarkCorr) | Q-value(MarkVario) |
|---|---|---|---|---|---|---|---|---|
| ID | Gene | Species | Tissue | Field of view | Q-value(Emark) | Q-value(Vmark) | Q-value(MarkCorr) | Q-value(MarkVario) |
Functional enrichment analysis of SV genes
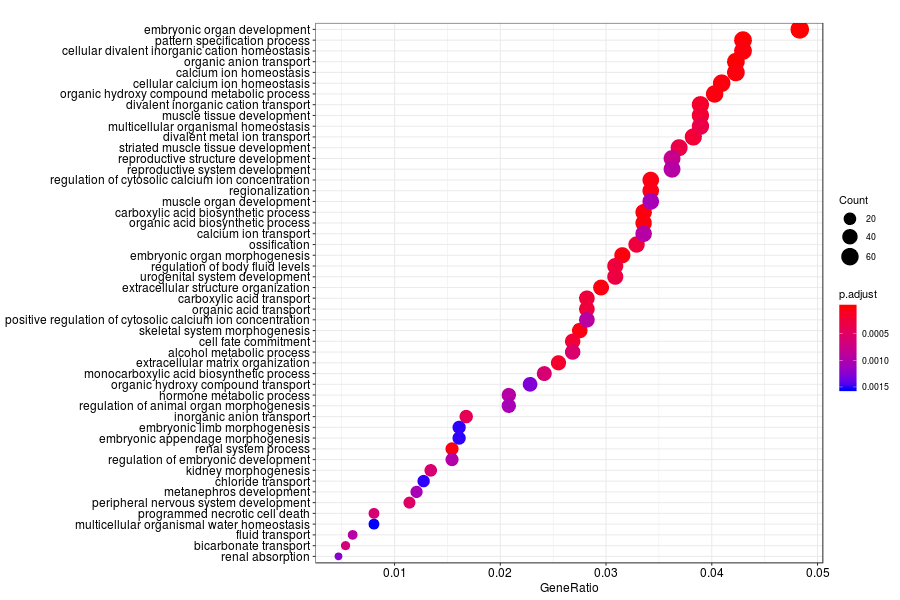
GO enrichment analysis of SV genes identified by SpatialDE (Q-value<0.05) in mouese olfactory bulb.
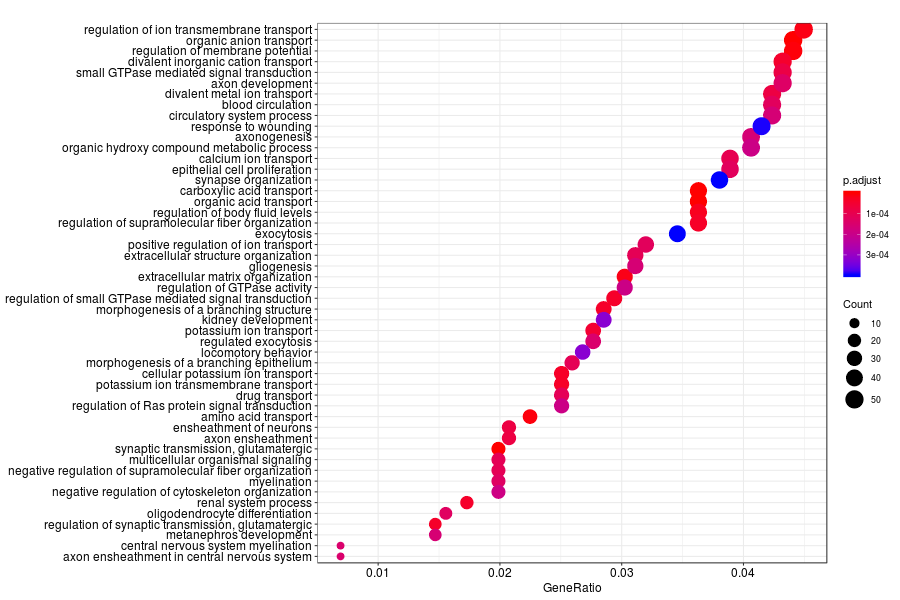
GO enrichment analysis of SV genes identified by SpatialDE (Q-value<0.05) in mouse cortex.
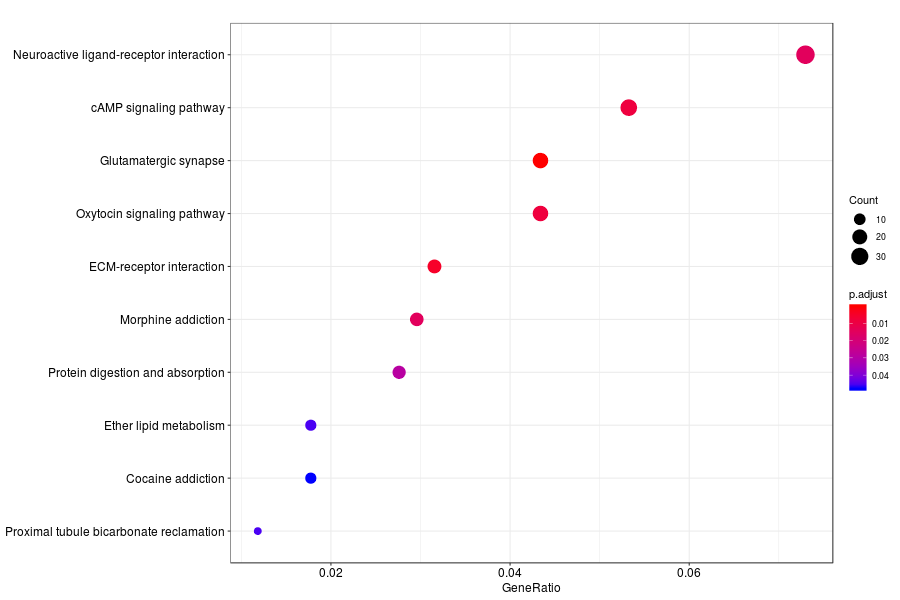
KEGG enrichment analysis of SV genes identified by SpatialDE (Q-value<0.05) in mouese olfactory bulb.
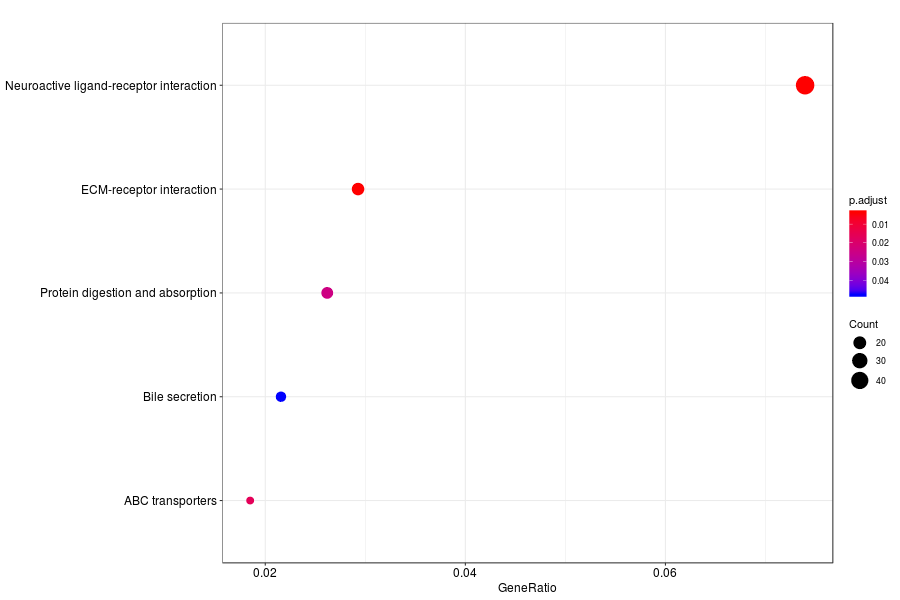
KEGG enrichment analysis of SV genes identified by SpatialDE (Q-value<0.05) in mouese cortex.