Dataset details
| Technique | Spatial transcriptomics |
|---|---|
| Title | Visualization and analysis of gene expression in tissue sections by spatial transcriptomics |
| PMID | 27365449 |
| Description | By positioning histological sections on arrayed reverse transcription primers with unique positional barcodes, this study demonstrated high-quality RNA-sequencing data with maintained two-dimensional positional information from the mouse brain and human breast cancer. |
| Source | adult C57BL/6 mouse (>2 months old) olfactory bulb, breast cancer biopsy |
| Species | human and mouse |
| No. genes | 19025 genes (mouse), 16385 genes (human) |
| No. cells | NA |
| Resolution | 100 um |
| Data normalization | Median ratio normalization |
| Data availability | Gene counts and scripts can be downloaded from www.spatialtranscriptomicsresearch.org. |
Spatially variable (SV) genes
SV genes identified by SpatialDE (Q-value<0.05)
| ID | Gene | Species | Tissue | Array | P-value | Q-value |
|---|---|---|---|---|---|---|
| ID | Gene | Species | Tissue | Array | P-value | Q-value |
SV genes identified by trendsceek (Q-value<0.05)
| ID | Gene | Species | Tissue | Array | Q-value(Emark) | Q-value(Vmark) | Q-value(MarkCorr) | Q-value(MarkVario) |
|---|---|---|---|---|---|---|---|---|
| ID | Gene | Species | Tissue | Array | Q-value(Emark) | Q-value(Vmark) | Q-value(MarkCorr) | Q-value(MarkVario) |
Functional enrichment analysis of SV genes
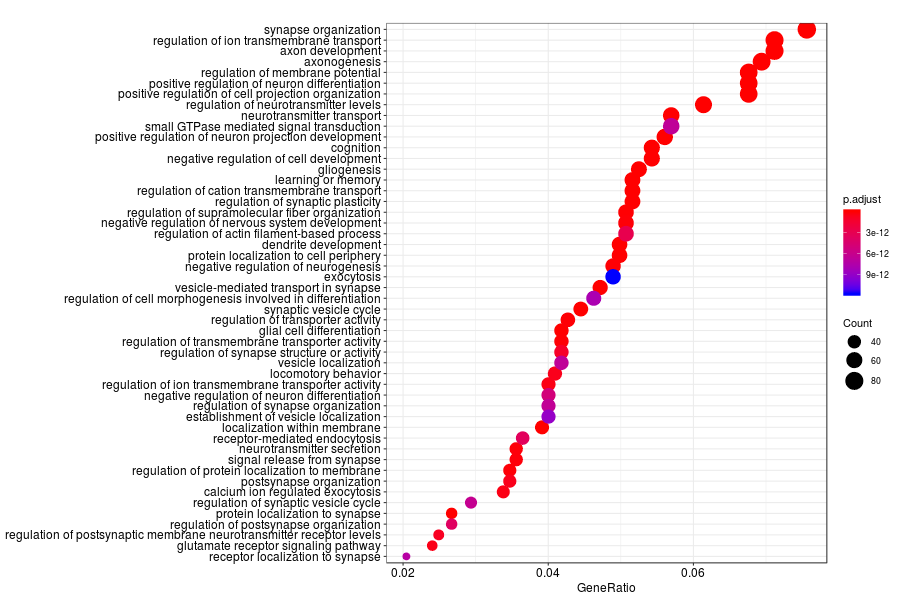
GO enrichment analysis of SV genes identified by SpatialDE (Q-value<0.05) in mouese olfactory bulb.
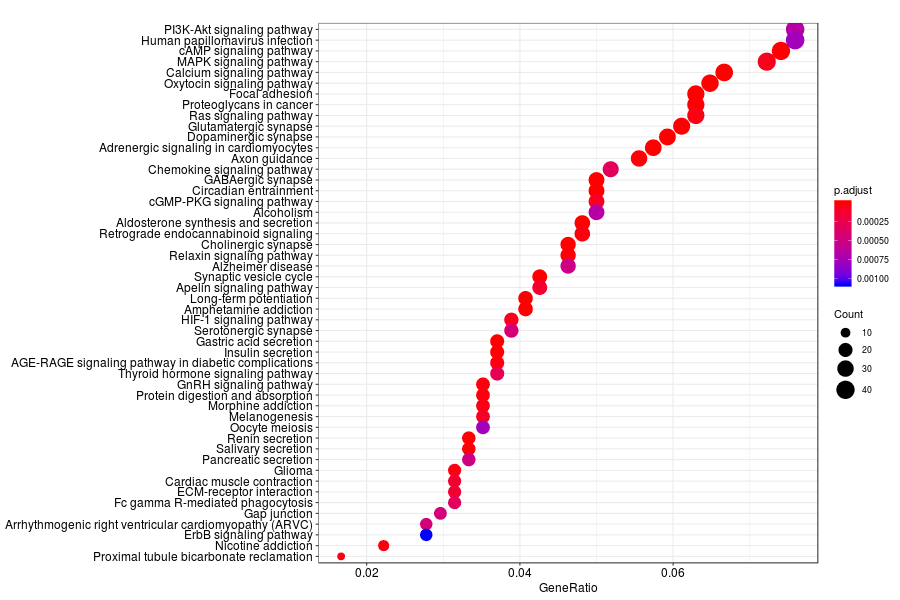
KEGG enrichment analysis of SV genes identified by SpatialDE (Q-value<0.05) in mouese olfactory bulb.
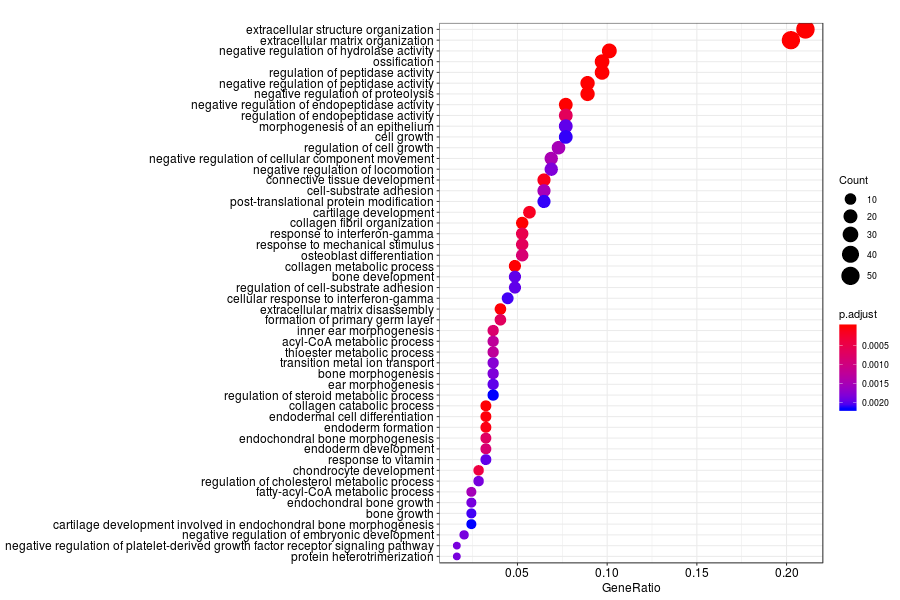
GO enrichment analysis of SV genes identified by SpatialDE (Q-value<0.05) in human breast cancer.
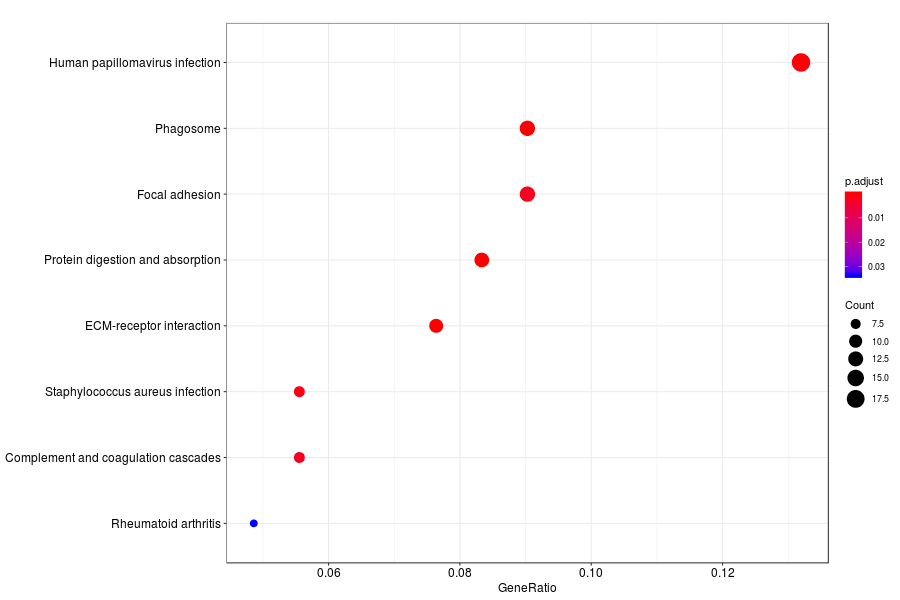
KEGG enrichment analysis of SV genes identified by SpatialDE (Q-value<0.05) in human breast cancer.