Dataset details
| Technique | Spatial transcriptomics |
|---|---|
| Title | Spatial maps of prostate cancer transcriptomes reveal an unexplored landscape of heterogeneity |
| PMID | 29925878 |
| Description | The study design involves twelve spatially separated biopsies taken from a cancerous prostate after radical prostatectomy. Overall, 5, 910 tissue regions within the 12 sections were analyzed. |
| Source | twelve spatially separated biopsies taken from a cancerous prostate after radical prostatectomy (Gs 3+4, pT3b, PSA=7.1) |
| Species | human |
| No. genes | 23484 genes |
| No. cells | NA |
| Resolution | 100 um |
| Data normalization | Median ratio normalization |
| Data availability | Count matrixes are available at www.spatialtranscriptomicsresearch.org. Sequencing data are deposited at the European Genome–Phenome Archive (EGA), hosted by the European Bioinformatics Institute (EBI), under the accession number EGAS0000100300. |
Spatially variable (SV) genes
SV genes identified by SpatialDE (Q-value<0.05)
| ID | Gene | Species | Tissue | P-value | Q-value |
|---|---|---|---|---|---|
| ID | Gene | Species | Tissue | P-value | Q-value |
SV genes identified by trendsceek (Q-value<0.05)
| ID | Gene | Species | Tissue | Q-value(Emark) | Q-value(Vmark) | Q-value(MarkCorr) | Q-value(MarkVario) |
|---|---|---|---|---|---|---|---|
| ID | Gene | Species | Tissue | Q-value(Emark) | Q-value(Vmark) | Q-value(MarkCorr) | Q-value(MarkVario) |
Functional enrichment analysis of SV genes
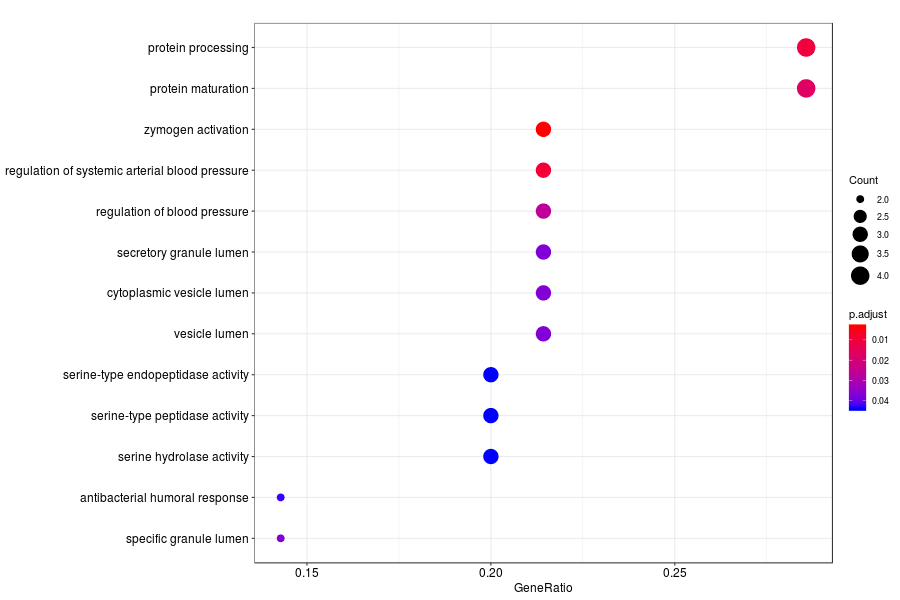
GO enrichment analysis of SV genes identified by SpatialDE (Q-value<0.05) in normal glands.
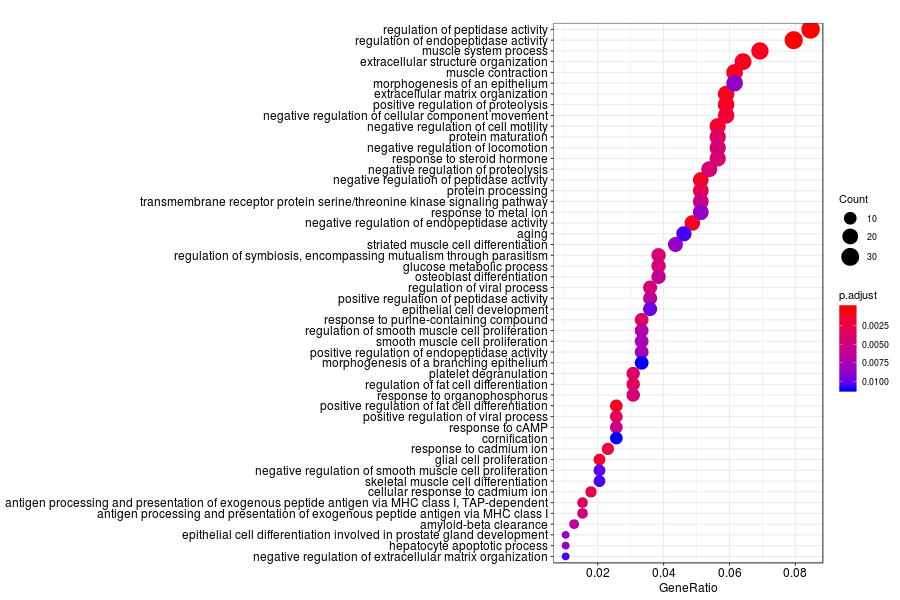
GO enrichment analysis of SV genes identified by SpatialDE (Q-value<0.05) in inflammation sections.
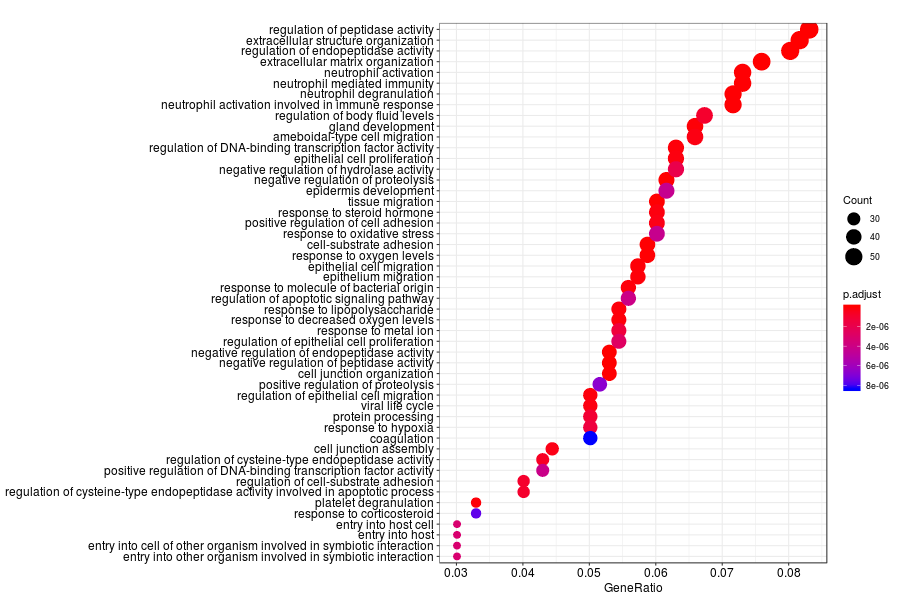
KEGG enrichment analysis of SV genes identified by SpatialDE (Q-value<0.05) in inflammation sections.
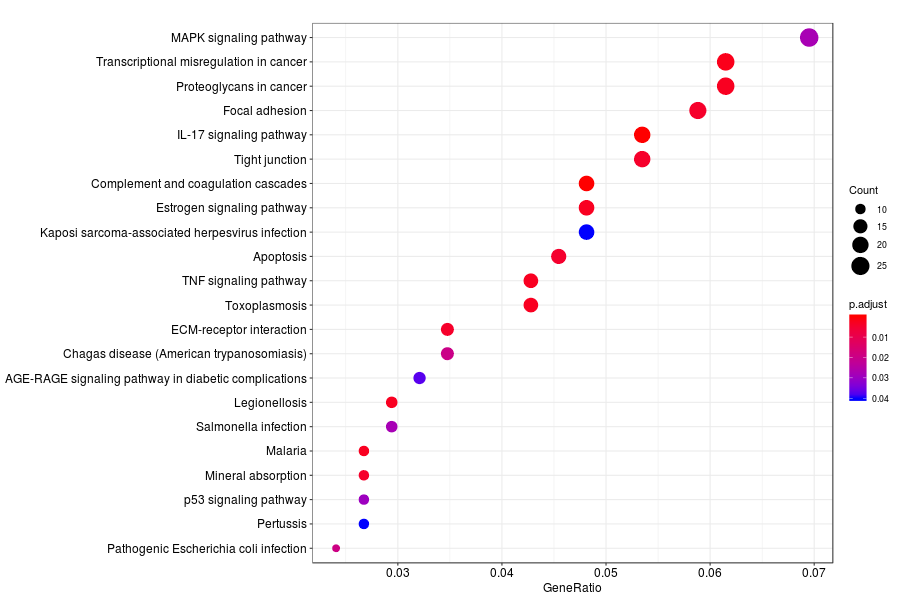
GO enrichment analysis of SV genes identified by SpatialDE (Q-value<0.05) in Gs 3+3(PIN3) section.
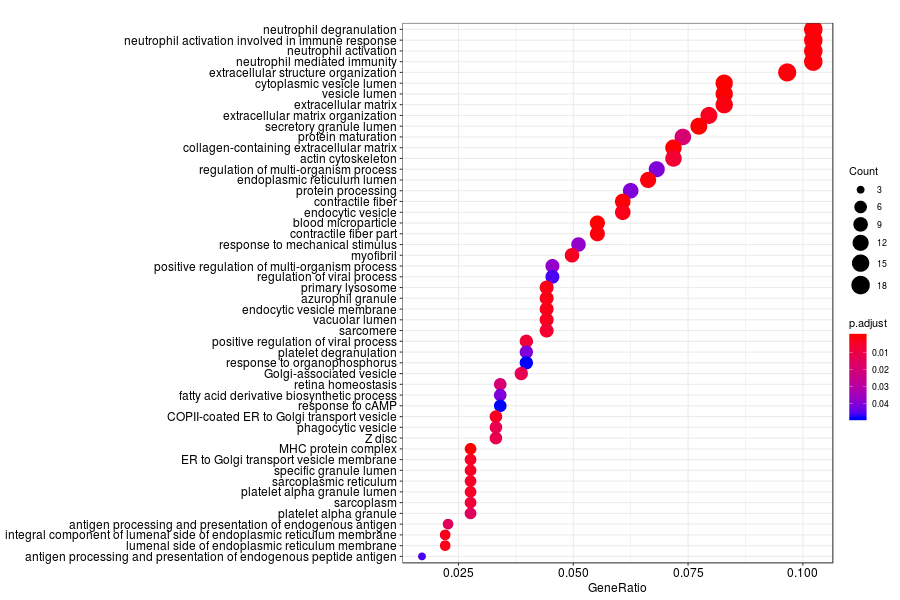
GO enrichment analysis of SV genes identified by SpatialDE (Q-value<0.05) in Gs 3+3(outside of area covered by array spots) section.
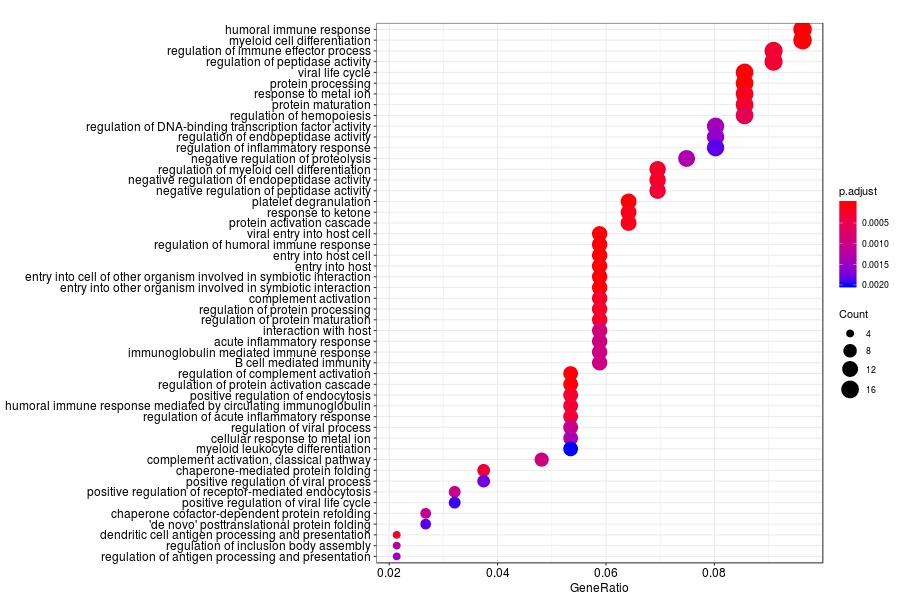
GO enrichment analysis of SV genes identified by SpatialDE (Q-value<0.05) in Gs 3+4(suspected Gs) section.
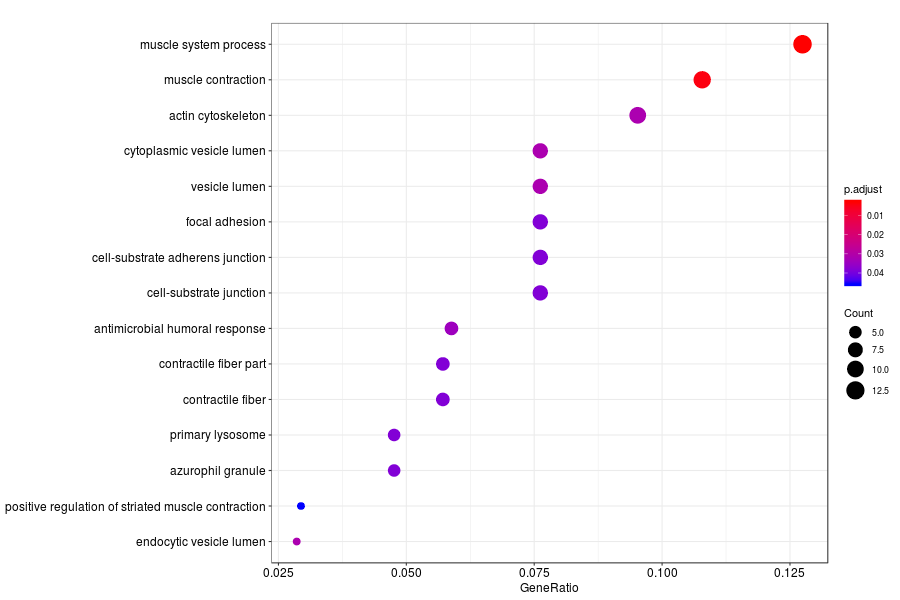
GO enrichment analysis of SV genes identified by SpatialDE (Q-value<0.05) in Gs 3+3(PIN) section.
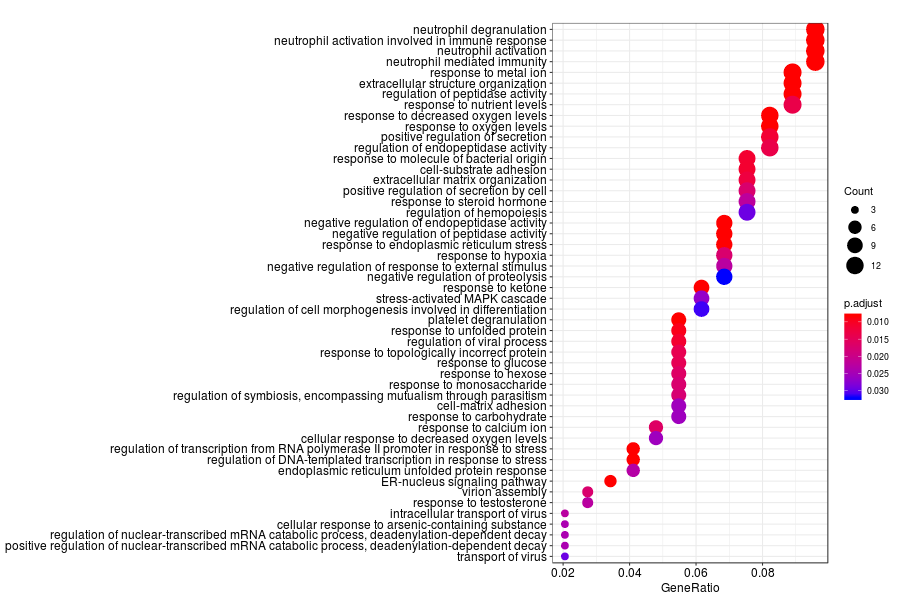
GO enrichment analysis of SV genes identified by trendsceek (Q-value<0.05) in normal glands.
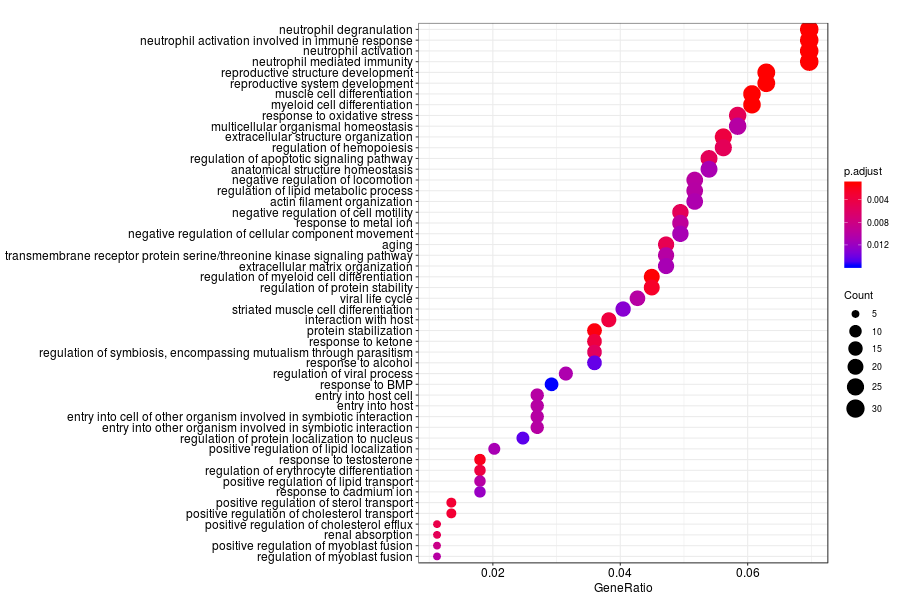
GO enrichment analysis of SV genes identified by trendsceek (Q-value<0.05) in inflammation sections.
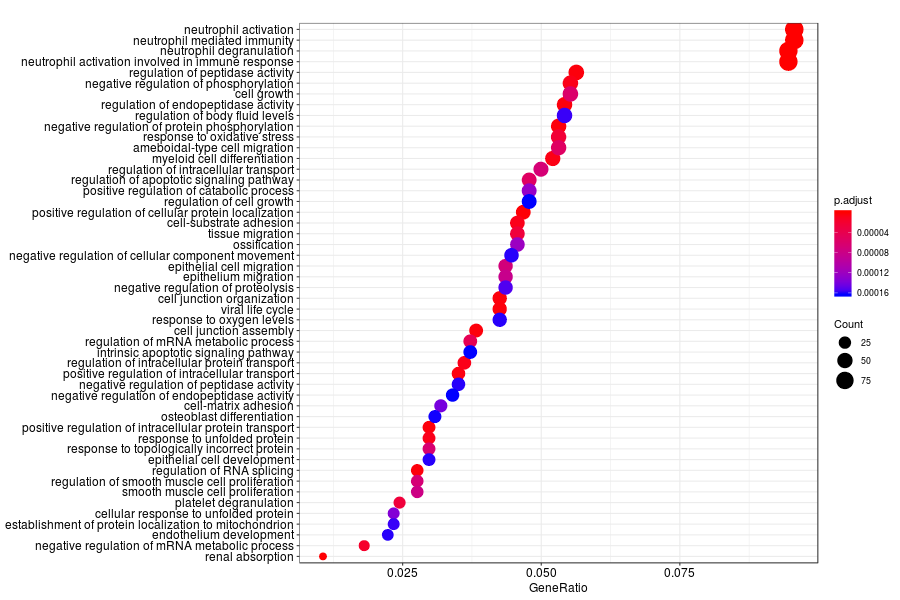
KEGG enrichment analysis of SV genes identified by trendsceek (Q-value<0.05) in inflammation sections.

GO enrichment analysis of SV genes identified by trendsceek (Q-value<0.05) in Gs 3+3(outside of area covered by array spots) section.
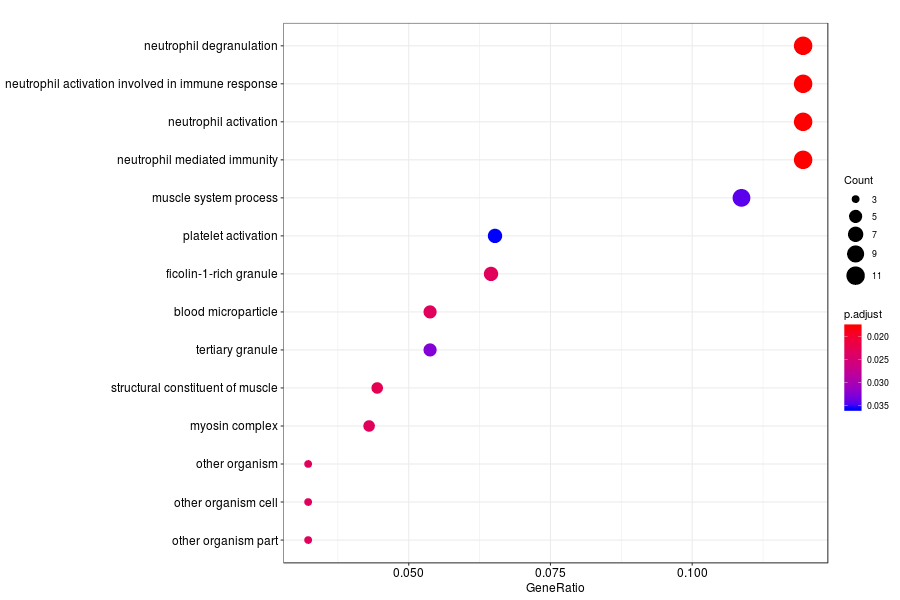
GO enrichment analysis of SV genes identified by trendsceek (Q-value<0.05) in Gs 3+3(PIN) section.
